
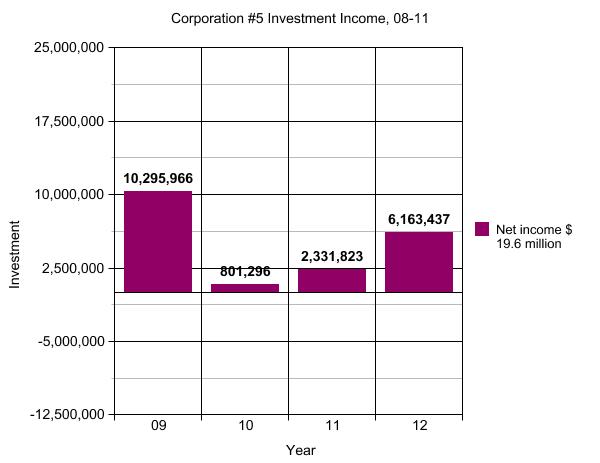
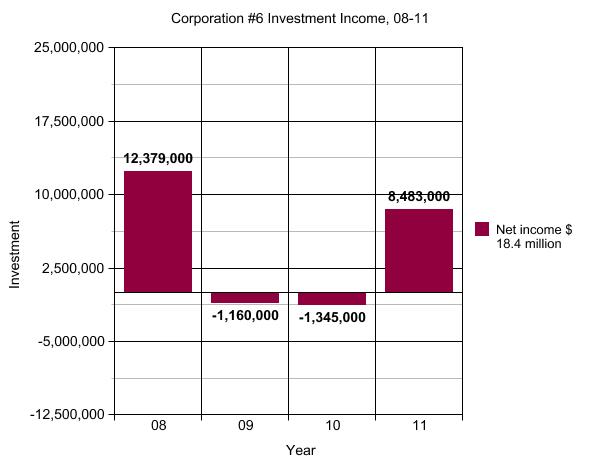
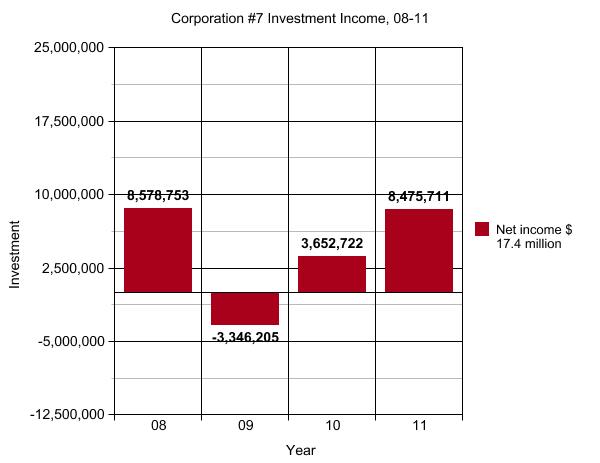
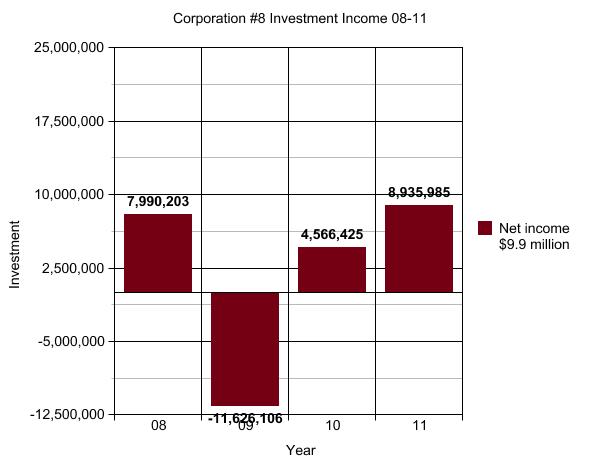
Let’s pretend you’ve been asked to analyze the investment income of eight corporations. Consequently, eight shiny charts have just been delivered to your desk…
***
Before you go any further, scribble down some thoughts, free of any preconceptions you bring to this blog. Who is doing the best? Who is doing the worst? Who is under-performing? Who is over-performing? Who had the best and worst years? Are there any questions you’d like to ask the men and women in charge of these corporations about the investment decisions they’ve made over the last few years?
***
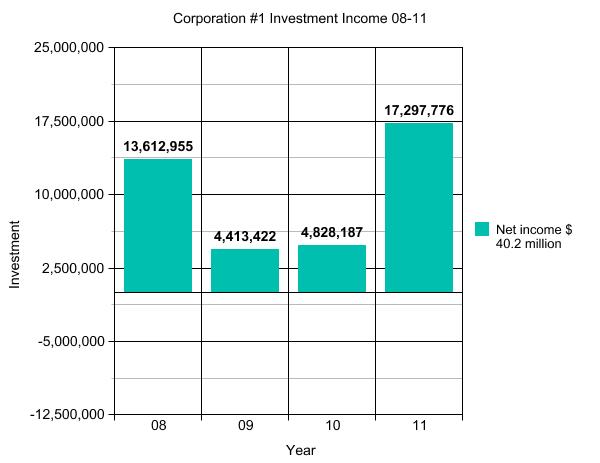
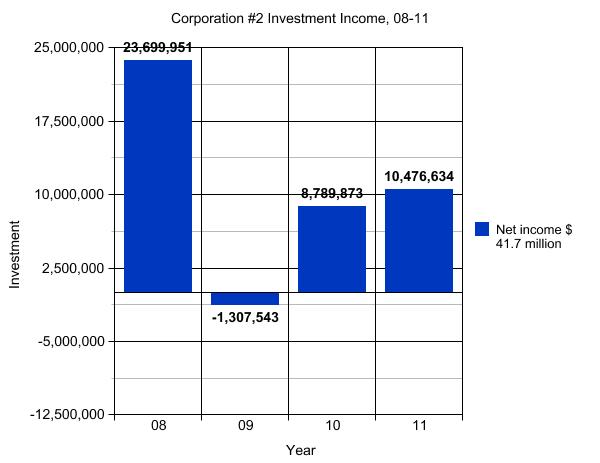
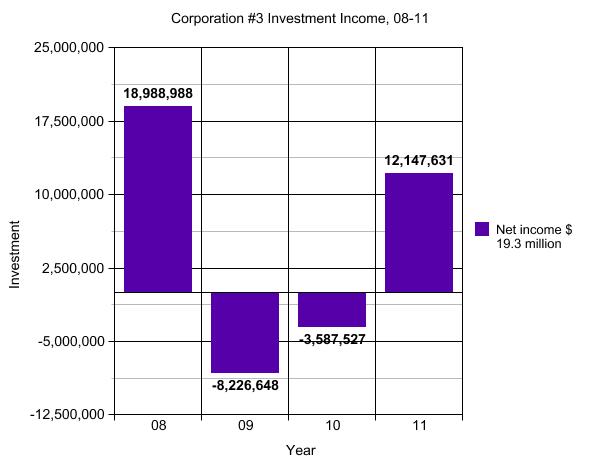
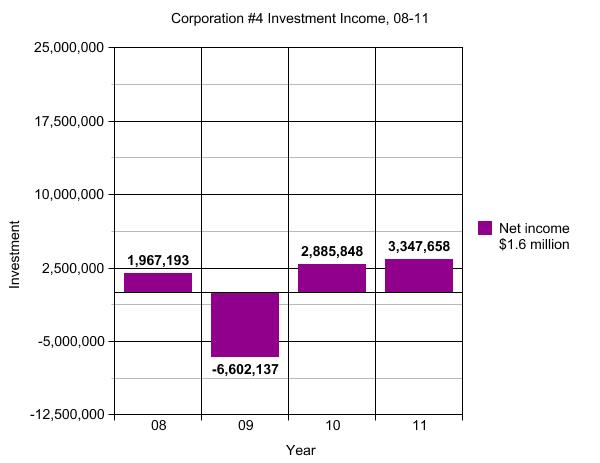
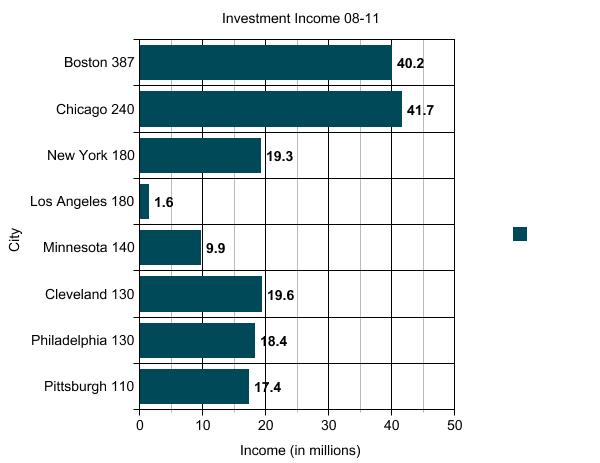
As you might have guessed, these corporations are orchestras, and I got the numbers from their 990s. From Corporation #1 to #8 they are Boston, Chicago, New York, Los Angeles, Cleveland, Philadelphia, Pittsburgh, and Minnesota. (These are the eight orchestras in the United States with endowments over $100 million.)
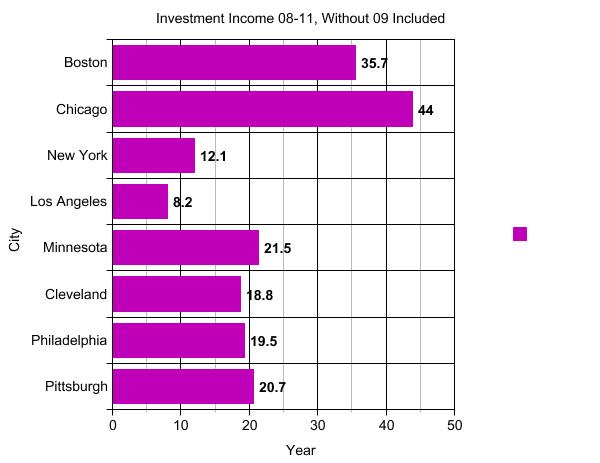
Here is their net investment income in one convenient graph form. (The size of their endowment appears after their name in millions.)
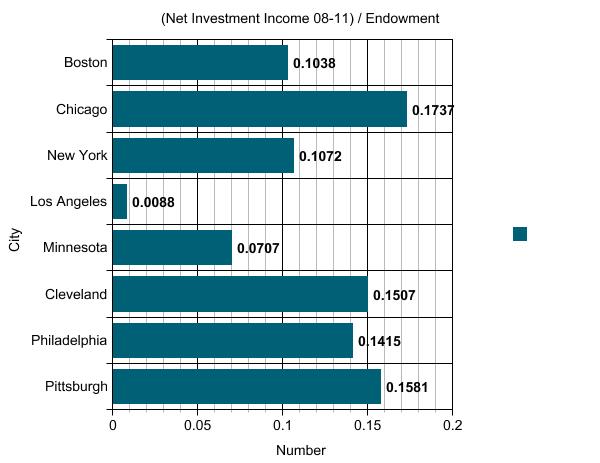
And although it’s imprecise, here is a chart of the (net investment income 08-11) / (dollars in endowment) equation. Just to take into account that Boston and Chicago have a lot more resources than we do…
And then another chart that represents what I see in my mind when I look at the last chart:
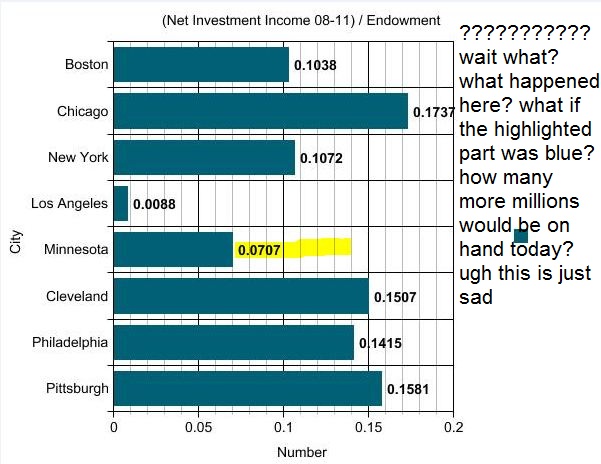
Totally scientific analysis
So when we’re talking about orchestras that appear to be under-performing their peers, two obviously jump out: Minnesota and Los Angeles.
However, I have a theory about Los Angeles… They earn a crap-load more program service revenue than Minnesota does. (I believe “crap-load” is the technical term non-profit analysts use.) Here, look:
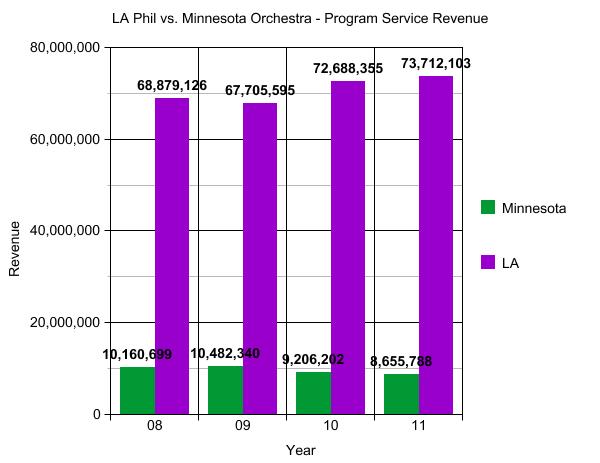
See? Crap-ton.
So they’re obviously not as reliant upon investment income as Minnesota is. For example, in FY 2011, Minnesota got 24% of its revenue from program service revenue, while LA got a whopping 67%. Minnesota depended on investment income for 25% of its revenue, while it only made up 3% of LA’s revenue. Therefore, a hit to their investment income won’t hurt them as much as it would hurt us.
So that brings us to Minnesota.
WTF, Minnesota?
A refresher
We didn’t do so badly in 2008, 2010, and 2011. We really didn’t. Actually, take 2009 away and we did really well.
But but but. In FY2009 the MOA sold $28.7 million in securities that they had paid $42.7 million for…resulting in a nearly $14 million loss.
I mean…damn.
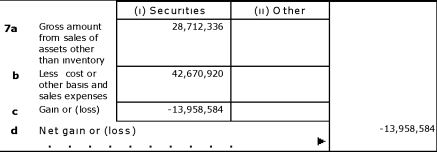
Damn. (from the 2009 990)
Also…
Damn.
While reading this, I remembered what Mary Schaefle had written back in “What We Know About the Minnesota Orchestra’s Finances – And What We Don’t“:
Unfortunately, 2008-09 is again the spoiler. The Orchestra sold a large amount of stock at a $13.9 million loss. It is well known advice to buy stocks low and sell high, and the 2008 market was low as a contrabassoon. It’s possible the stock was on its way to becoming a penny stock. But why would they own such a volatile, risky stock? It could be a bad decision or bad investment advice – to the tune of almost $14 million. I know you’re ready with my next line. A review by an investment analyst would certainly help explain some things.
I’m no investment analyst and I don’t pretend to be. (I don’t even play one on TV.) However, I’d love to hear the full story behind this stinker of a year…especially once I saw that no other American orchestra had such a big loss that year. So why did we? What were the securities that were sold? Why were they sold? Who made the decision to sell? Did the securities rebound in value, or were they indeed on their way to becoming penny stocks? If so, why did the MOA have such a stock in its portfolio? Did this loss have anything to do with the MOA being unhappy with and switching their investment adviser? Who was the dumped investment adviser? Did the adviser have any connection to anyone on the board? Do board members have any additional information that they’d like to step forward to share? Did Jon Campbell or Richard Davis or Wells Fargo or US Bancorp have anything to do with any of this? Is a brand new lockout conspiracy theory about to explode in popularity?
As always, I’m open to critiques, corrections, and comments.

Emily, thanks so much for yet again illustrating that “Something is rotten In the State of Denmark.” It indeed would great to know why… Because it is tantalizing to postulate why our fine orchestra got stuck with not only incompetent ORCHESTRA management but also incompetent FINANCIAL management.
One of Henson & Co’s “mature” decisions???
As my sister, who didn’t know all that much about this mess, said.quite a while ago, “Follow the money” Dig Emily, Dig! We would have been better off having chimps investing OUR money for the orchestra.
thoughts (some of which might be nit-picky)
I’ve had lectures on the topic of data presentation. Fascinating topic. None of this is meant to be personal – you did a good job selecting information to present your points.
1 – initial 8 graphs – there is no $0 line on the y-axis. You should always have a Zero on graphs like this.
2 – The y-axis values go far beyond the actual dollar values presented, which means there’s far more white/blank space than is necessary. This psychologically produces a different impression.
oops – I just realized the reason is that the last graph (ours) has a huge loss, and the scale of the y-axis was to take into account the huge loss, while retaining the same scale on all of the data sets. Congratulations on that point.
3 – the first graph comparing all 8 orchestras on same graph – while you stated the number after the name is the endowment size (thank you), you didn’t mention that the orchestras were now sorted by increasing size. Putting the number first, i.e. 140-MInnesota, so that the reader’s eye is drawn to the number, rather than the name, would help.
4 – same graph – similar point you cannot easily see the actual comparison of the endowment sizes. Here this is the most important factor being compared in the graph. That information should be the most easily seen on the y-axis. The easy to see is just which is bigger, and does now allow a good idea of *how* much bigger without effort. Effort = bad on graphs.
5 – btw – is “investment income” generally understood by the audience reading this? If not, it ought to be explained. If it’s understood by everyone other than me, than it should be left as is. You shouldn’t always aim for the lowest person’s understanding.
If the Orchestra managed to be in bed with an investment adviser that was bullish on mortgage-backed CDOs to the point of owning several tranches of AAA rated securities that ceased to be valued at anywhere near previous levels could reduce a portfolio by a large amount. Maybe they had investments in a fund that was run by Lehman Brothers and parceled out at sub-market rates after Lehman failed. Maybe they had investments in a fund that Bear Stearns was running before they collapsed. Maybe, due to board obligations, they were invested massively in US Bank and Wells Fargo and took a giant loss when those stocks took a fall after the 2008 “market correction” (I believe that is the business school mandated euphemism for a market crash).
Investment advising is a tricky business–especially if you were driven into the arms of a specific firm because of connections to a board member or a the recommendation of another Orchestra. An advisers job is to prevent massive loss–however, you can count on the fingers of only two hands the actual number of people who saw 2008 coming and planned accordingly. And unless the board chose an adviser that was in bed with Goldman Sachs, Deutche Bank, Barclays, or JP Morgan (the ‘winners’) and not one that was in bed with Lehman, Bear Stearns, Merrill Lynch, or Morgan Stanley (the ‘losers’) they would be affected. Without actually knowing the assets in question (common stock, treasuries, collateralized debt, etc) it would be hard to pin down blame on management or create a conspiracy to defund the endowment absent a SEC criminal filing against the investment adviser. They fired the adviser for probably being too stupid to understand when to get out of a market while waiting long enough to appease whichever board member recommended the guy.
I have no idea whether the Orchestra was a client of FAF Advisors, which was the brokerage/investment subsidiary of US Bank until 2010. At that time, FAF was split up and sold. If they were, that could explain some things.
Lark do your charts back up this claim?
“The MOA endowment has exceeded investment return benchmarks over the last five years.”
Source:
http://www.minnesotaorchestra.org/about/contract-talks/misrepresentation-vs-reality
I have no idea what “exceeded investment return benchmarks” means. There is no technical definition for that term, so it can’t be verified or disputed.
Return on Investment (ROI) is basically any monies you receive from investments. Simple example: I buy 1 share of Wells Fargo for $10 and at the end of the year the share price closes at $10.50 I have a ROI of 50 cents. Investment advisers set “benchmarks” for their various portfolios of securities. Some portfolios show a conservative allocation of stocks and bonds others show an aggressive allocation of stocks and bonds. The benchmark is merely the minimum expected return based on the portfolio composition. For example, as an intern at one of these investment houses I presented to a prospective client the following two scenarios:
1. Portfolio A–80% bonds, 10% S&P Stocks, 10% General Stocks, expected return 7% of investment income.
2. Portfolio B–50% NASDAQ Stocks, 25% S&P Stocks, 10% Bonds, 5% General Stocks, expected return 12% of investment income.
I explained that A was conservative and B was aggressive. In reality, our models showed that A would return 9-10% if the bond market maintained historical averages; our models showed B would return 14-15% if the NASDAQ and S&P maintained historical averages. Considering the growth in the markets for the years in question, the models would be blown away by the growth and the average over 5 years–including a historic loss–would be mitigated by the bubble’s growth.
To conclude, as long as the Orchestra received some kind of positive return on investment from the portfolio, an accountant can choose a time period where the portfolio would outperform some stated benchmark. And as shown above, it behooves an adviser to set a benchmark that is lower than expectation to outperform said expectation–one of the many reasons why marketing/PR materials from investment groups are worthless.
Yes, but as you say, the word “benchmarks” could mean any number of things, and it is therefore meaningless. Whose returns? What years? What does “consistently” mean? etc
I take your point with regard to the ambiguity of the exact meaning of the terminology. However, the fact that they choose to state it in the manner that they did might suggest something. Like proof of another crafted message.
http://www.mcf.org/publictrust/faq_endow
FYI……….The MOA hired a Manager of Corporate Relations in January 2013. Another example that they seem to be hiring as the musicians are still locked out.
Edward, Andrew and Anon…
I think this blog post serves best to point out areas of useful investigation…no one is really expecting an armchair financial analysis here. Rather, Emily has distilled, through the chart visuals, reasons for patrons (or perhaps even board members) to take action and ask questions. Your expertise is appreciated though.
Edward, all the best on that paper your group is writing at business school.